This post is also available in:
![]() Português
Português
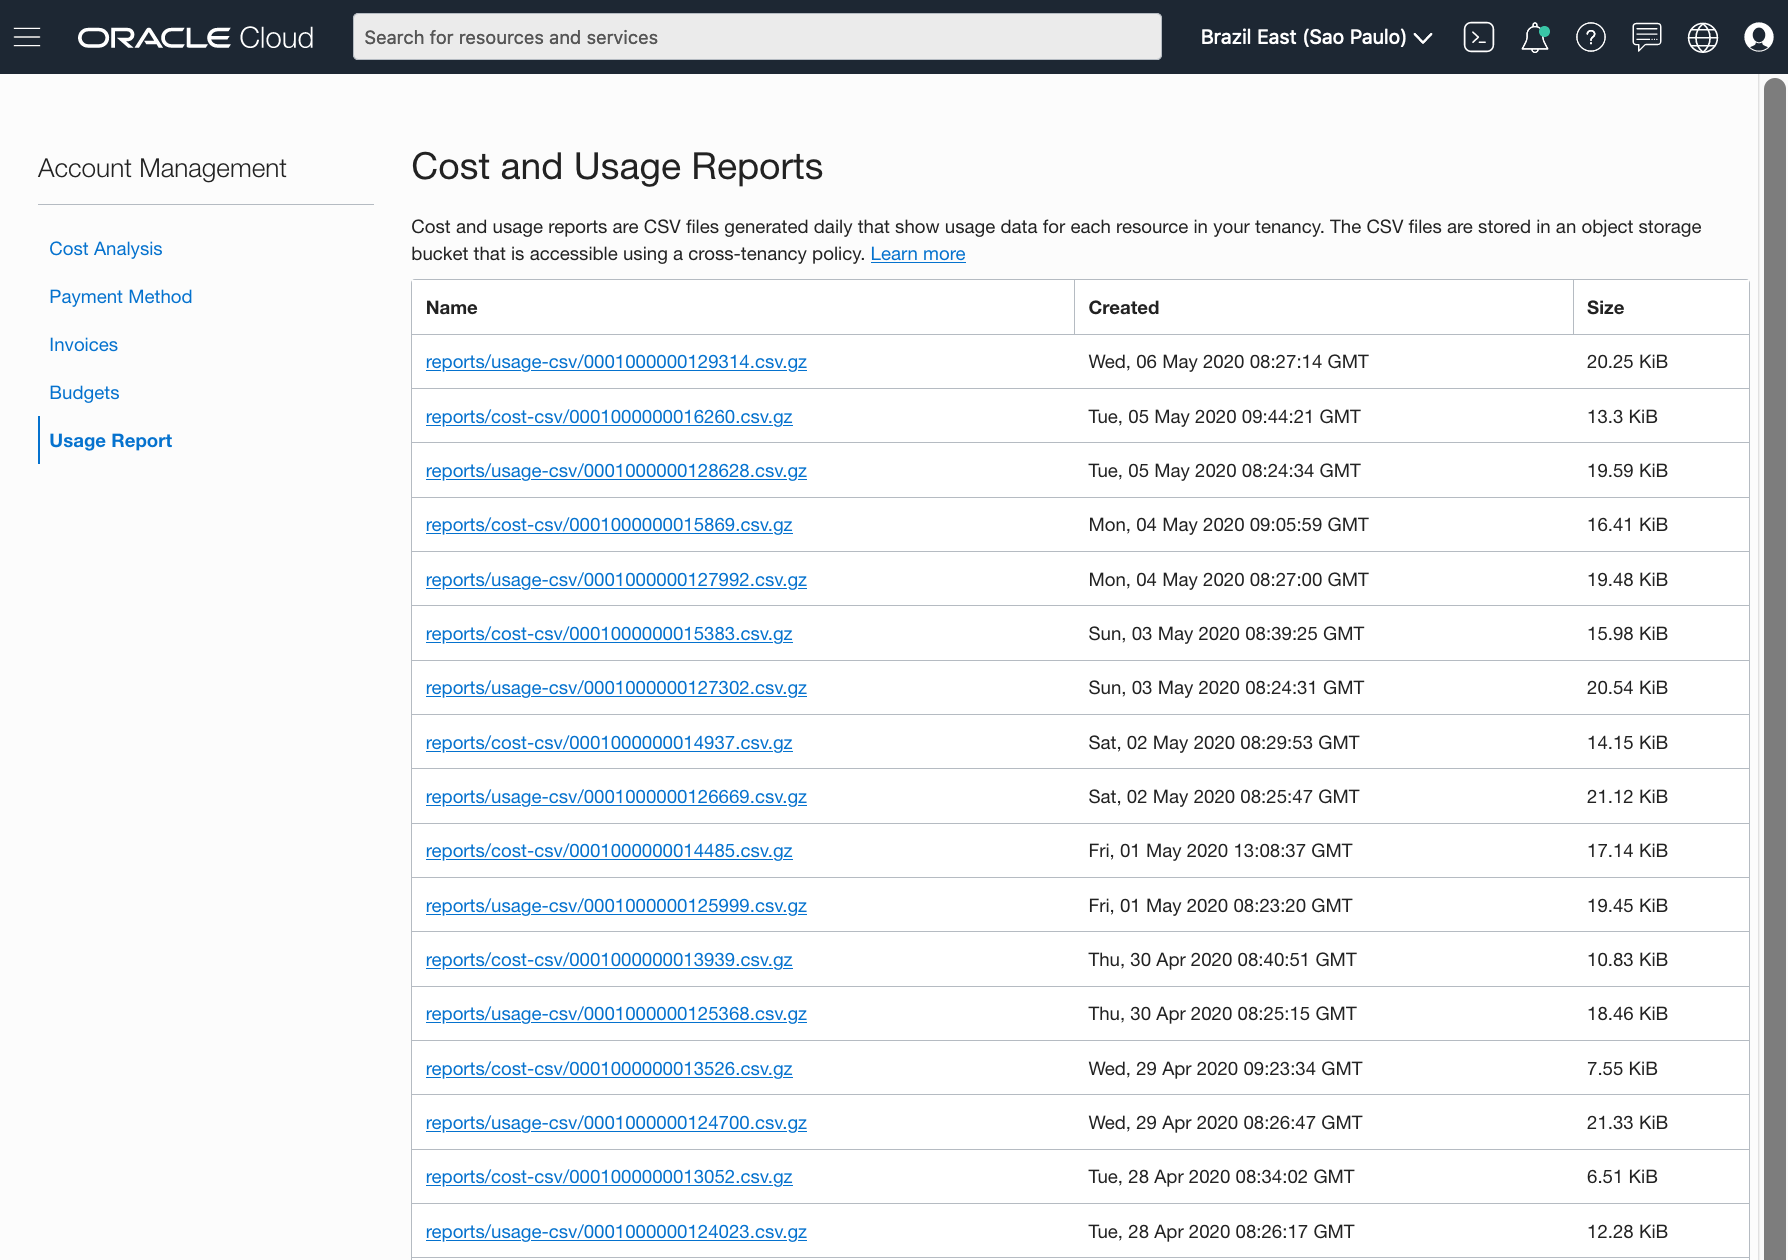
To track your tenancy cost and usage reports, Oracle made available from the OCI portal the capability of downloading files that are generate daily and uploaded to the bling storage bucket. However, it lack the feature to download all files at once for a specified timeframe.

Note: To enable this, you require some policies in your tenancy, described in this link: https://docs.cloud.oracle.com/en-us/iaas/Content/Billing/Tasks/accessingusagereports.htm
I'm planning to public release soon some usage and billing graphs on OCI360 tool in order to provide users a comprehensive understanding of where they are spending their resources over their tenancy. However, first step before importing those metrics inside the tool is creating an export tool, and that's how oci_csv_usage.sh was born.
The script is publicly available at my github oci-scripts page.
$ oci_csv_usage.sh
Usage: oci_csv_usage.sh <option> [begin_time] [end_time]

Valid <option> values are:
-r    - RUN. You need to provide this parameter to execute this script.
-d    - Dry run. Will show you only the commands to get the files that would be executed.

[begin_time] (Optional) - Defines start time when exporting Usage Info. (Default is 30 days back)
[end_time]   (Optional) - Defines end time when exporting Usage Info. (Default is today)

PS: it is possible to export the following variables to change oci-cli behaviour:
- OCI_CLI_ARGS - All parameters provided will be appended to oci-cli call.
  Eg: export OCI_CLI_ARGS='--profile ACME'
So, how does it work?
You simply call the script either passing "-r" (to execute it) or "-d" (dry-run - will just return back the oci-cli command lines that would be executed). When running with "-r", the script will loop over all the usage and cost CSV files provided by oracle in their bucket and download, consolidating all together in a single zip file. The time frame from the collected CSVs can be changed providing the 2nd and 3rd parameters.
So, all tasks in OCI360 are divided in 3 major steps:
- First we extract from OCI.
- Second we load this data into an Oracle table.
- Third we run SQLs to create custom reports and graps based on this data.
1st step is done. Stay tuned that soon I will make available amazing graphs on the tool.
Have you enjoyed? Please leave a comment or give a 👍!


4 comments
Skip to comment form
Very Good information.Great Job
Author
Thanks.
I like your script - very good work that helps me a lot. However I am interested only in cost report not usage - is there a way to pass a parameter to get this happening?
Author
Hi Rajan, there is a long time since I don't check and update those scripts. Indeed there is a way, but unfortunately, I have no time to develop it. But please, feel free to change it.